Web Clubs

LALIGA

Institutional

LALIGA

with sport

LALIGA

Group

LALIGA

INSTITUTIONAL

LALIGA WITH

SPORT

LALIGA

GROUP

Fact of the week

Three keys to Real Madrid’s success

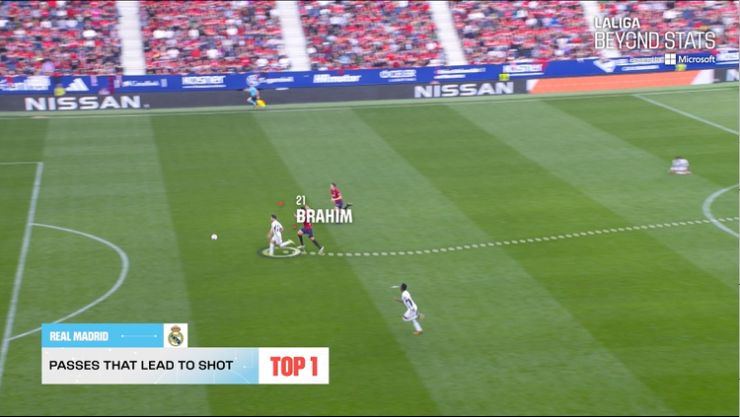
Although with Carlo Ancelotti’s side we tend to focus on build-up play, we can also analyse the way that they win the ball back in order to kick off their attacking phases. They are the team with the fifth-most recoveries in the final third, and this allows them to launch their attacks from within the danger zone. They are also aided by their intensity, as the team who cover the greatest distance at the top speeds (over 28 km/h). On the back of this defensive and physical analysis, we come to the creative side which we mentioned to begin with, and we find that they are the team who produce the most passes leading to shots in the competition.

Remarkable Coach

Xavi and Barcelona’s upturn

Los Azulgranas have undergone a clear improvement in recent matchdays. So much so that if we were only to look at games since the season’s midway point, they would be top of the league. Focusing on the figures which they have amassed over the entire season, we can see that they are the team with the second-most carries in total, the most carries into the box and the most high-impact attacking actions, which are those leading to a goalscoring opportunity. Switching phases, we can also note that they are the team with the third-most rapid recoveries. 


Share

Key Player

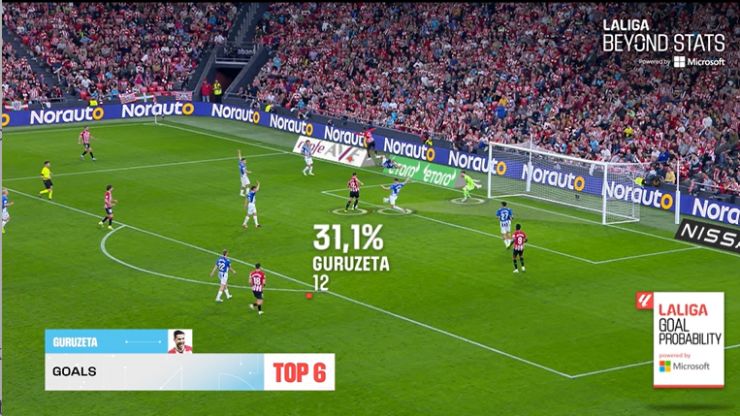
Guruzeta makes his mark as a top LALIGA goalscorer

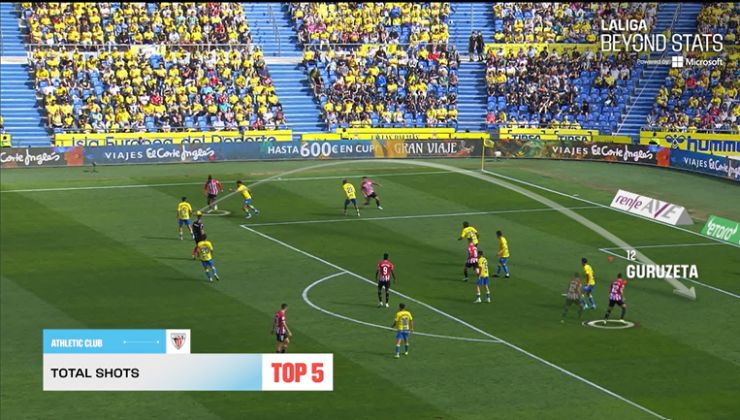
He is the sixth-highest scorer in the competition, as well as boasting a collection of other top stats. He is seventh on shots on target and 23% of his shots end in a goal. His positioning on the pitch allows him to play a leading role in the build-up, acting as an important partner for the Williams brothers, but he also has the ability to finish. Another of his qualities is the threat which he offers from set pieces, having become an important player in actions following corners. ‘Guru’ is increasingly instrumental for his team, as are his goals and effectiveness.

Share

The Match up

A top-tier physical battle: Real Madrid v Athletic Club

Both teams excel on stats concerning winning the ball back and intensity, so we are clearly in for a very lively game. As you can see in the radar chart, Real Madrid shoot more and pass more in the attacking zone, but the stats become extremely even when it comes to the total distance covered and distances covered at over 21 and 24 km/h. Ernesto Valverde’s side come out on top on crosses, with their penetration down the flanks followed by quality crosses into the box serving as a source of chances and goals. 


Share

Remember his name

Zakharyan and his salience for La Real

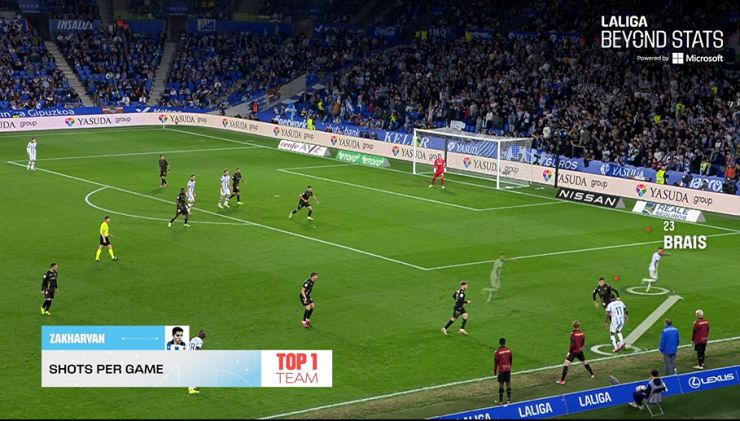
He is the player who takes the most shots on average per match among the entire Real Sociedad squad, at 2.4. This figure gives us an insight into just how important a player he is for his team when he is on the field of play. What’s more, he is among the top four in his team for passes leading to shots and on carries into the box. This shows that he is not only a player who has the ability to finish off moves, but also one who makes the difference when it comes to creating chances.


Metric of the week

Attacking build-up play: passes per possession

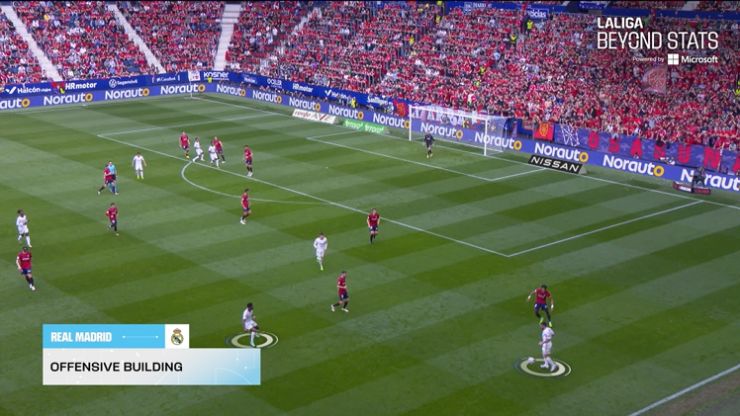
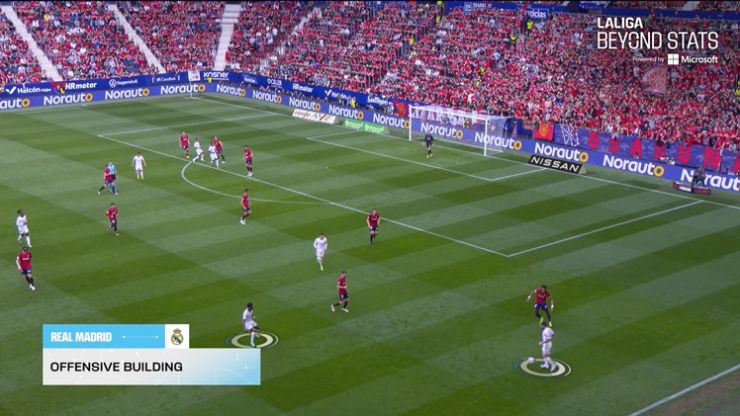
We continue to advance with our analysis of possession, which has long since ceased to be limited to a simple percentage. This component is now measured in moments and zones. Furthermore, we can now identify what happens in each individual possession. Thanks to this evolution we have come up with a new indicator: attacking build-up play. This consists of quantifying how many passes each team plays per possession. This stat is then calculated as the average per game and it provides a great deal of insight into each team’s style of play. Real Madrid are currently the team who play the most passes, on average, per possession. 


Share

Te explicamos cómo obtenemos estos datos de prepartido a través de la mejor tecnología

Beyond Stats ofrece métricas increíbles en la industria del fútbol: no se limita a recopilar los datos que se suelen usar para los análisis estándarque llegan a los aficionados, sino que va más allá, recopilando una cantidad ingente de información durante el partido, casi en tiempo real, gracias a la herramienta Mediacoach de LALIGA, que es capaz de revelar nuevas percepciones sobre el juego a un nivel más profundo permitiendo trazar patrones y obtener proyecciones de futuro.

Los datos brutos recogidos (Raw Data) son tratados para su análisis por un equipo multidisciplinar compuesto por expertos en Business Intelligence & Analytics y análisis futbolístico de LALIGA a través de procesos de Machine Learning e Inteligencia Artificial que se han hecho posibles gracias a la tecnología Azure que provee Microsoft, capaz de procesar grandes volúmenes de datos. Tras su tratamiento, se genera un algoritmo que permite la visualización de las métricas que llegan al aficionado por medio de Beyond Stats. Estas estadísticas permiten a los aficionados entender mejor por qué su equipo ha ganado un partido, lo ha perdido, o tener una visión panorámica de su rendimiento y expectativas, lo que permite una inmersión inédita en la experiencia del espectador de fútbol.

En todos los estadios de LALIGA encontramos hasta dieciséis cámaras perimetrales fijas de alta resolución para el tracking óptico que siguen en el terreno de juego la situación de jugadores, árbitros y balón, recogiendo datos físicos y técnico-tácticos a un ritmo vertiginoso de 25 veces por segundo.

“Encontramos hasta dieciséis cámaras perimetrales fijas de alta resolución para el tracking óptico”

Estos dispositivos permiten la integración, a través de la herramienta de análisis Mediacoach, de dos tecnologías: tracking y eventing. El tracking se apoya en la información de seguimiento recogida por las cámaras perimetrales del estadio, y permite elaborar métricas como las referidas a distancia recorrida, velocidad máxima y media, o número de sprints. Mediante el eventing se registran los eventos más objetivables: número de pases, córners, o faltas cometidas y recibidas. La información captada a través de tracking y eventing se integra y almacena en el sistema formando un conjunto de datos de gran volumen.