Web Clubs

LALIGA

Institutional

LALIGA

with sport

LALIGA

Group

LALIGA

INSTITUTIONAL

LALIGA WITH

SPORT

LALIGA

GROUP

Fact of the week

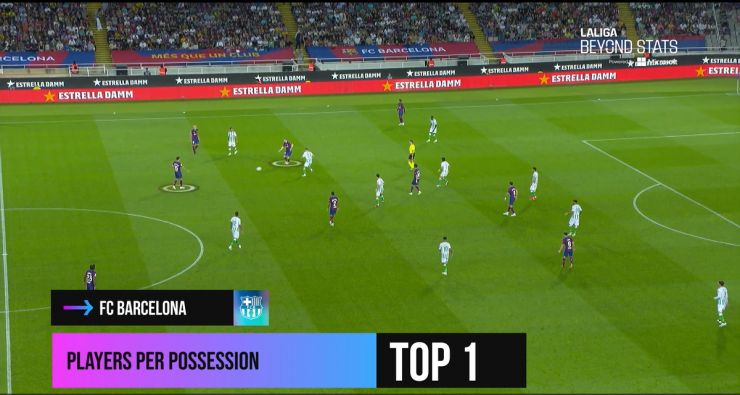
Possession holds key to Barça threat.

For quite some time now, possession has been about far more than just a percentage figure, with this metric encompassing a whole series of other elements. By way of example, we’re able to measure the number of players per possession, with FC Barcelona leading the way in the Spanish top tier in this department. The Catalan giants come out on top for the average number of players involved in each attack. This strategy reaps its rewards both in numerical terms and efficiency, with the Azulgranas posting the highest percentage of dangerous possessions (8%). This metric also results in the Camp Nou-based outfit recording the most passes in the final third and contributes to their status as the league’s bridesmaids when it comes to attempts on goal. These metrics clearly complement and go a long way to explaining each other.

Fact of the week

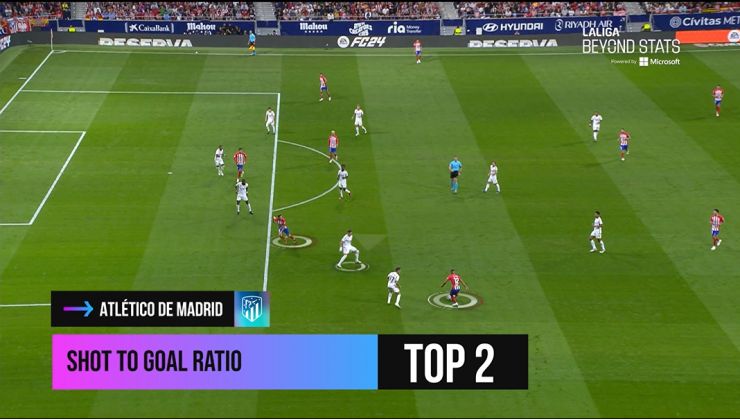
Rojiblancos display goalscoring efficiency & ruthlessness

Atletico Madrid sit pretty in second spot in the LaLiga ranking for the number of attempts required to score after performing consistently in this department in the early weeks of the season. However, the Colchoneros are not handily placed in the standings for the total number of attempts or attempts on goal, but the statistics show that when they create a goalscoring opportunity, their quality shines through. Carries are a go-to strategy deployed by Diego Simeone’s men to give them the best chance of scoring. Indeed, Atleti claim a podium place for the number of carries that beat the opposition’s midfield line, while they feature amongst the top four for carries that overcome the opposition’s defensive line. In short, the Madrilenians boast quality aplenty to carry the ball into the opposition’s box.

Within this analysis, we shouldn’t forget Atletico’s trademark defensive transitions, where they are the fifth top-performing team in the league in terms of the press after losing possession, while the boys from the Metropolitano bag third place for the number of recoveries with a numerical advantage. These statistics just go to show how impressive the capital club are in both the possession and defensive phases of the game.

Share

Te explicamos cómo obtenemos estos datos de prepartido a través de la mejor tecnología

Beyond Stats ofrece métricas increíbles en la industria del fútbol: no se limita a recopilar los datos que se suelen usar para los análisis estándarque llegan a los aficionados, sino que va más allá, recopilando una cantidad ingente de información durante el partido, casi en tiempo real, gracias a la herramienta Mediacoach de LALIGA, que es capaz de revelar nuevas percepciones sobre el juego a un nivel más profundo permitiendo trazar patrones y obtener proyecciones de futuro.

Los datos brutos recogidos (Raw Data) son tratados para su análisis por un equipo multidisciplinar compuesto por expertos en Business Intelligence & Analytics y análisis futbolístico de LALIGA a través de procesos de Machine Learning e Inteligencia Artificial que se han hecho posibles gracias a la tecnología Azure que provee Microsoft, capaz de procesar grandes volúmenes de datos. Tras su tratamiento, se genera un algoritmo que permite la visualización de las métricas que llegan al aficionado por medio de Beyond Stats. Estas estadísticas permiten a los aficionados entender mejor por qué su equipo ha ganado un partido, lo ha perdido, o tener una visión panorámica de su rendimiento y expectativas, lo que permite una inmersión inédita en la experiencia del espectador de fútbol.

En todos los estadios de LALIGA encontramos hasta dieciséis cámaras perimetrales fijas de alta resolución para el tracking óptico que siguen en el terreno de juego la situación de jugadores, árbitros y balón, recogiendo datos físicos y técnico-tácticos a un ritmo vertiginoso de 25 veces por segundo.

“Encontramos hasta dieciséis cámaras perimetrales fijas de alta resolución para el tracking óptico”

Estos dispositivos permiten la integración, a través de la herramienta de análisis Mediacoach, de dos tecnologías: tracking y eventing. El tracking se apoya en la información de seguimiento recogida por las cámaras perimetrales del estadio, y permite elaborar métricas como las referidas a distancia recorrida, velocidad máxima y media, o número de sprints. Mediante el eventing se registran los eventos más objetivables: número de pases, córners, o faltas cometidas y recibidas. La información captada a través de tracking y eventing se integra y almacena en el sistema formando un conjunto de datos de gran volumen.